We protect the American people and uphold the U.S. Constitution.
You can report suspicious activities and crime by contacting us 24/7 at tips.fbi.gov.
I Want To


Featured Content
FBI Launches Trauma Notification Training

The FBI has launched an updated, mobile-friendly Trauma Notification Training program to help ensure trauma notifications are delivered with professionalism, dignity, and compassion.
Financially Motivated Sextortion

Sextortion is a crime that involves adults coercing kids and teens into sending explicit images online. The FBI has several resources to help caregivers and young people better understand what sextortion is, how to protect against it, and how to talk about this growing and devastating threat.

Capitol Violence
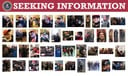
The FBI is seeking to identify individuals involved in the violent activities that occurred at the U.S. Capitol and surrounding areas on January 6, 2021. View photos and related information here. If you have any information to provide, visit tips.fbi.gov or call 1-800-CALL-FBI.
News
Stories
-
04.22.2024
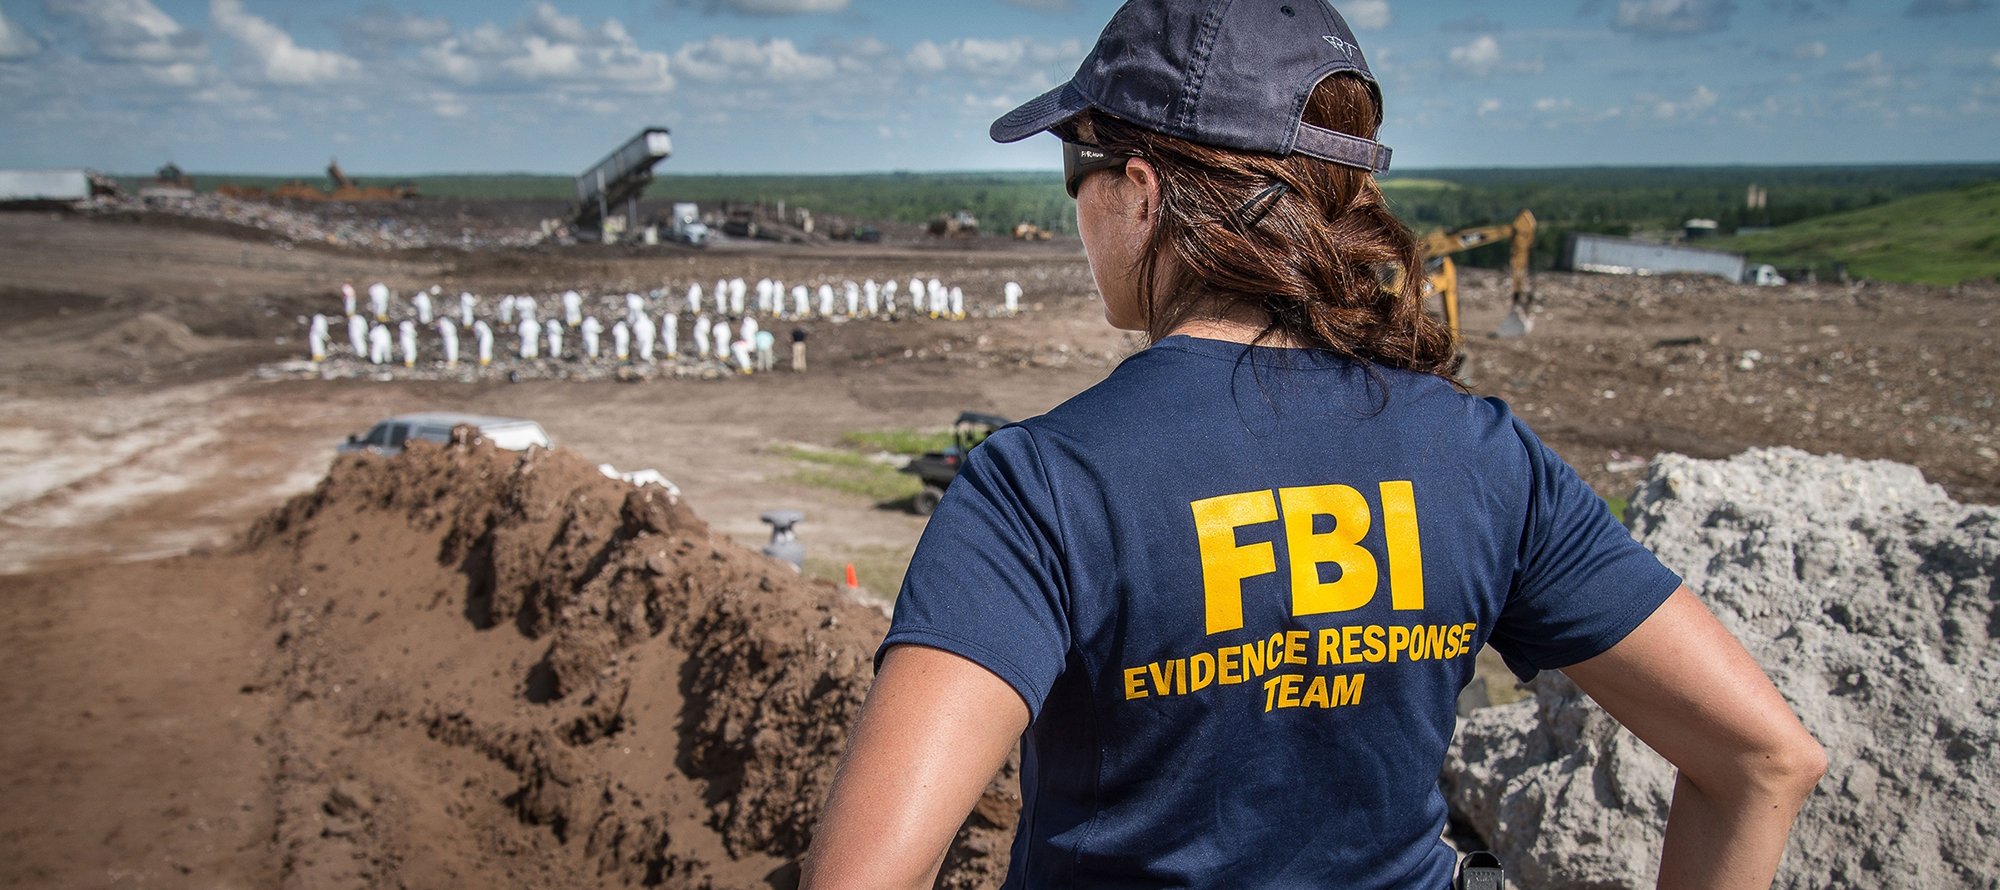
Investigating Environmental Crimes: The Huntington Oil Spill
The FBI and partners used groundbreaking techniques and advanced technology to investigate the 2021 disaster.
-
04.22.2024
FBI Launches Trauma Notification Training
The FBI has launched an updated, mobile-friendly Trauma Notification Training program to help ensure trauma notifications are delivered with professionalism, dignity, and compassion.
-
04.18.2024
Wray: Chinese Government Poses 'Broad and Unrelenting' Threat to U.S. Critical Infrastructure
FBI Director Christopher Wray warned national security and intelligence experts that the risks posed by the government of China to U.S. national and economic security are “upon us now."
-
04.17.2024
'A Great Partner in the Community'
An Oklahoma City area pastor who had a run-in with the FBI in the late ’90s is set to be honored by the Director and special agent who once pursued him.
Podcasts
-
04.18.2024
Inside the FBI Podcast: Investigating Torture
On this episode of Inside the FBI, we’ll share the story behind a joint investigation by the FBI and Homeland Security Investigations that helped secure the second-ever conviction under the United States’ federal torture statute since its implementation in 1994.
-
03.29.2024
Inside the FBI Podcast: What Happened to Karla Rodriguez?
On this episode of Inside the FBI, learn how the Bureau and our law enforcement partners are working to find Karla Carolina Rodriguez, who disappeared in Las Vegas in October 1999.
-
02.29.2024
Inside the FBI Podcast: The Phantom Hacker Scam
On this episode of Inside the FBI, learn about the Phantom Hacker scam—a type of tech support scam that's growing in popularity—and how to avoid becoming its next victim.
-
01.26.2024
Inside the FBI Podcast: Top Ten Fugitive Vitel'Homme Innocent
On this episode of Inside the FBI, learn about Ten Most Wanted Fugitive Vitel’Homme Innocent—leader of the Haitian gang Kraze Barye—who was allegedly involved in kidnapping U.S. citizens and holding them hostage.
Press Releases
-
04.24.2024
FBI Criminal Justice Information Services Division Assistant Director Michael A. Christman Retires
-
04.24.2024
North Carolina Man Sentenced for Assaulting Law Enforcement During January 6 Capitol Breach
-
04.22.2024
Louisiana Man Pleads Guilty to Felony Charge for Actions During January 6 Capitol Breach
-
04.22.2024
-
04.22.2024
The FBI Marks National Crime Victims' Rights Week, Launches the Trauma Notification Training Program
-
04.22.2024
Kristin Rehler Named Special Agent in Charge of the Jacksonville Field Office
-
04.19.2024
-
04.19.2024